Malaysia: The Key Selected Statistics During Past Economic Crises
- BOPstatsMY

- Apr 22, 2020
- 2 min read
Updated: Apr 23, 2020
Key selected statistics in the past three economic crises 1998, 2001 and 2009. Check out what were the statistics during these crises : GDP, GNI per capita, CPI, PPI, Commodities prices, Current Account Balance, Labour force and population.
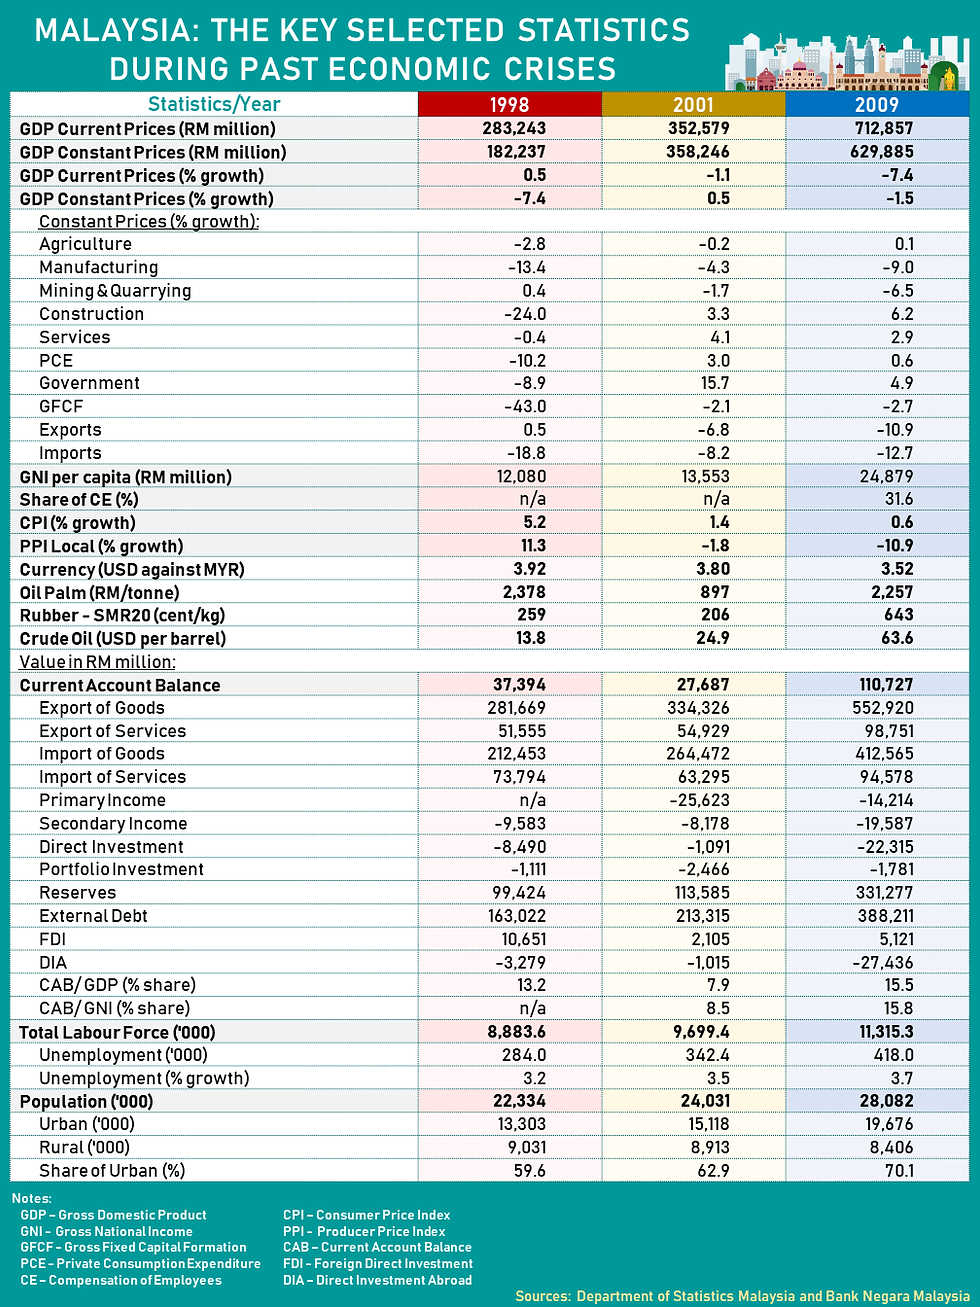
Scenario of 1998:
1. The GDP was -7.4%, sectors badly affected were Manufacturing & Construction
2. Household expenditure, Government expenditure and Investment (GFCF), declined by double digit
Scenario 2001:
1. GDP was 0.5%, Manufacturing and Mining were in negative trend, both exports n imports were also negative. Nevertheless government' s expenditure was 15.7% that could mitigate the overall economy in line with the Keynesian theory.
2. Commodities were badly hit with Oil Palm RM897 per tonne, Rubber RM2.06 per kg and Crude Oil USD24.9 per barrel
3. Current account balance had surplus of RM27.7billion, due to lower exports and downtrend of commodities prices
4. FDI was RM2.01 billion only
Scenario in 2009:
1. GDP declined to 1.5%, current prices was worst with -7.4%
2. Manufacturing, Mining, Investment (GFCF), Exports and Imports were in negative trend
3. Current account balance was high, reverse trend compared to GDP as the Imports declined much bigger than Exports, that gave an advantage for the higher Surplus
4. FDI was RM5.1billion, Unemployment 3.7%
5. Commodities prices were favourable with Oil Palm more than RM2k, Rubber RM6.42 and Crude Oil USD63.6, however it could mitigate the overall situation
All these crises reflect on our nation's dependency on Manufacturing, Mining, Commodities. Lets move towards high end industries.....we provide you the stats, dwell it and lets move ahead !! ✌✌🤗🌹🔽🔼
#statistics4u
DOSM will release the Q1 2020 GDP on 13th May 2020, stay tuned....😄
Malaysia: Statistik Terpilih Semasa Krisis Ekonomi
Statistik terpilih semasa krisis ekonomi tahun 1998, 2001 dan 2009. Lihat apakah statistik yang terpilih semasa krisis ini: KDNK, PNK per kapita, CPI, PPI, Harga komoditi, Imbangan Akaun Semasa, Tenaga Buruh dan Penduduk.
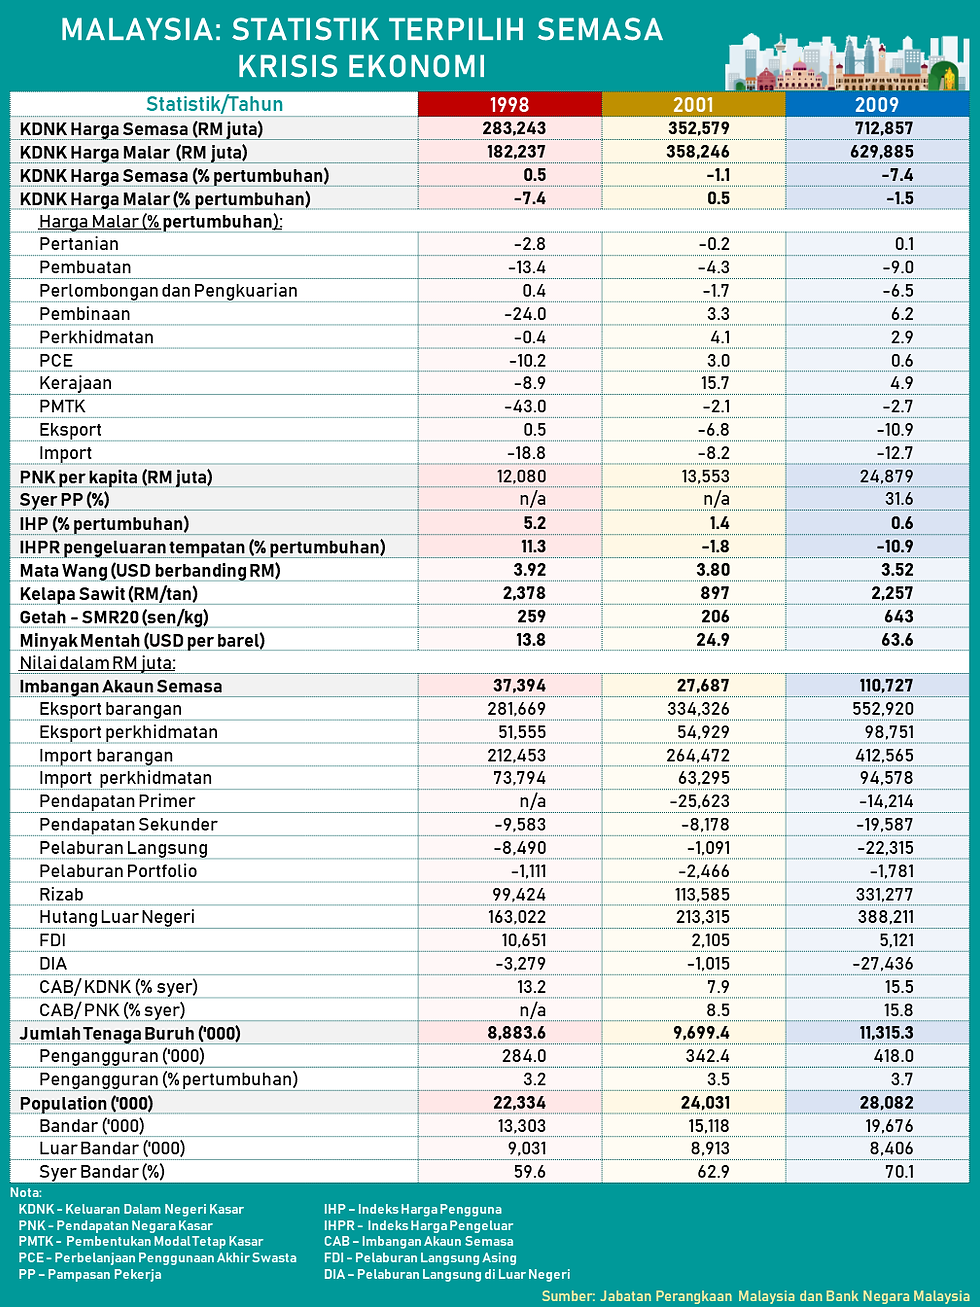
Senario 1998: 1. KDNK adalah -7.4%, sektor yang terjejas teruk adalah Pembuatan & Pembinaan 2. Perbelanjaan isi rumah, perbelanjaan Kerajaan dan Pelaburan (GFCF), menurun dua digit Senario 2001: 1. KDNK adalah 0.5%, Pembuatan dan Perlombongan berada dalam tren negatif, kedua-dua eksport dan import juga negatif. Walaupun, perbelanjaan kerajaan adalah 15.7% yang dapat mengurangkan ekonomi secara keseluruhan selari dengan teori Keynesian. 2. Komoditi yang terjejas teruk Kelapa Sawit RM897 per tan, Getah RM2.06 per kg dan Minyak Mentah USD24.9 setong 3. Imbangan akaun semasa mempunyai lebihan RM27.7 bilion, disebabkan oleh eksport yang lebih rendah dan kejatuhan harga komoditi. 4. FDI hanya merekodkan RM2.01 bilion. Senario pada tahun 2009: 1. KDNK menurun kepada 1.5%, harga semasa menurun sebanyak -7.4% 2. Pembuatan, Perlombongan, Pelaburan (GFCF), Eksport dan Import berada dalam tren negatif 3. Imbangan akaun semasa adalah tinggi, trend sebaliknya berbanding dengan KDNK kerana Import menurun jauh lebih besar daripada Eksport, yang mendorong kepada Lebihan yang lebih tinggi 4. FDI adalah RM5.1 bilion, Pengangguran 3.7% 5. Harga komoditi lebih baik dengan Kelapa Sawit lebih dari RM2k, Getah RM6.42 dan Minyak Mentah USD63.6, namun ia dapat mengurangkan keadaan keseluruhan Semua krisis ini mencerminkan kebergantungan negara kita terhadap Pembuatan, Perlombongan, Komoditi. Mari bergerak ke arah industri berteknologi tinggi ..... kami memberikan anda statistik, sila menggunakannya dan terus maju !! ✌✌🤗🌹🔽🔼
DOSM akan menerbitan KDNK Q1 2020 pada 13 May 2020, stay tuned....😄


Comments